Opportunity: Data Visualization/Graphics Design Specialist, ECOGIG-2
– February 11, 2015
The “Ecosystem Impacts of Oil and Gas Inputs to the Gulf” (ECOGIG-2) research consortium invites applications for staff position dedicated to data reduction, data visualization, GIS/mapping, and graphic design.
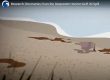
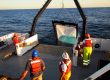
The ECOGIG-2 program is funded by the Gulf of Mexico Research Initiative (GoMRI). The program conducts multiscale, multidisciplinary research to study the impacts and fates of oil and gas released in offshore waters of the Gulf of Mexico (hereafter, Gulf). With more than 20,000 natural hydrocarbon seeps, the Northern Gulf hosts complex and fascinating ecosystems that are intimately tied to oil and gas seepage. Seeps and their environs are influenced by complex large- and small-scale circulation patterns, as well as significant nutrient inputs from the Mississippi River system. The Gulf is therefore an ideal natural system for studying feedbacks from natural and accidental hydrocarbon releases and the physical and biological processes that determine their fate. The ECOGIG-2 team’s work will improve our ability to understand, quantify and predict the large and small-scale processes that distribute and degrade hydrocarbons throughout the Northern Gulf, from the deep seafloor to the ocean surface. ECOGIG-2 scientists will work at scales ranging from molecules to ecosystems, and from point source inputs to the entire Gulf system. The program will employ novel, highly sophisticated technologies to achieve in situ monitoring of benthic and water column dynamics on time scales from a few weeks to as long as a year (for more information, see: http://research.gulfresearchinitiative.org/research-awards/projects/?pid=268).
The Program’s “Data Visualization” staff member will work closely with Project Director (PD), Samantha Joye, and other PIs to create visual tools and products that illustrate, display, and highlight the program’s research findings. This is a data visualization/graphics design position but the work will also foster the program’s education and outreach efforts.
Successful candidates must have a background in data illustration, experience with GIS systems, be self-motivated, efficient and effective at both verbal and written communication, and interested in facilitating innovative research and education in a highly dynamic environment. Applicants with experience in data visualization, graphic design, and creating maps and multi-dimensional descriptions of oceanographic data and are comfortable working a dynamic, interdisciplinary work environment will receive preferential consideration.
The position duties are split roughly equally between:
- Work with large data sets to facilitate data reduction and visualization
- Produce graphics and maps from large data sets
- Produce conceptual figures for publications and presentations
- Produce conceptual figures and posters for education and public outreach events
Experience in the following is strongly preferred/required:
- MATLAB, R, SQL, JavaScript, D3.js, and Microsoft Excel
- Adobe Creative Studio, CartoDB, Plot.ly
- Extensive experience with GIS based mapping software (GeoBase, GeoServer, GeoNode, CARIS, etc.)
If you have questions or would like more information, please contact ECOGIG-2 PD, Dr. Mandy Joye at mjoye@uga.edu.