Study Estimates Larger-than-Expected Oil Footprint Near the Damaged Taylor Energy Platform
– FEBRUARY 26, 2019
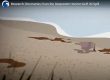
Researchers analyzed remote sensing imagery to assess oil slicks near the Taylor Energy platform, which was damaged by Hurricane Ivan in September 2004, and determined how environmental conditions affected the slicks’ distributions. Imagery showed no surface oil in most of 2004, but in 2005, 40% of cloud-free images showed slicks, and this number increased to 70% in 2006 – 2011 and >80% since 2012. Using all cloud-free images from 2005 to 2016, the team estimated an oil discharge rate of 48-1,700 barrels/day, which reached a cumulative area of approximately 1,900 km2 in the regions surrounding the Mississippi Delta. Their analyses suggest that the detected oil slick distribution can be largely explained by surface currents, winds, and density fronts associated with Mississippi River plumes.
The researchers published their findings in Marine Pollution Bulletin: Remote sensing assessment of oil spills near a damaged platform in the Gulf of Mexico.
After Hurricane Ivan damaged the Taylor Energy oil platform (Mississippi Canyon 20), there were seven months of near-daily aircraft overflights that reported oil slicks as large as approximately 1.6 km wide and 9 km long covering an average area of 20 km2. Despite mitigation efforts, the oil discharge has continued. Study author Chuanmin Hu explained, “The spill around the Taylor platform was originally thought to be negligible but it appears to be much larger, yet the impacts on the ecosystem are still unknown. Since initial surveys, there has been no systematic assessment to document the ongoing spill. Our paper represents the first study to present the spill’s history, with the spill’s footprint documented and spill volume estimated.”
The researchers used medium- to high-resolution (10-30 m) optical remote sensing imagery to systematically assess oil spilled between 2004 and 2016. Hu explained, “Satellite remote sensing provides rapid and synoptic assessment of surface oil, and has been used during and after the Deepwater Horizon oil spill as well as for other spills. After decades of technology advancement, the technology is pretty mature in detecting surface oil and defining a spill’s footprint. However, estimating the oil quantity (either volume or thickness) is still technically challenging. Our paper presents such a challenge and proposes an approximate solution based on several assumptions.”
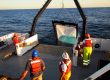
The team analyzed 513 images and identified 294 cloud-free images (all with strong sun glint, necessary for accurate slick detection); data from 2010 were excluded to avoid potential spatial overlap with the Deepwater Horizon oil spill. Oil slick delineation was accomplished with imagery from Landsat U.S. Geological Survey (USGS)/EarthExplorer, wind speed data were from the National Centers for Environmental Prediction, and river discharge data were from USGS and the Army Corps of Engineers. The team compared surface ocean circulation simulated by the Hybrid Coordinate Ocean Model with satellite-detected oil spreading. They applied a Textural Classifier Neural Network Algorithm to identify floating oil and delineate the slick area and calculated oil estimates using published field measurements from airborne and cruise surveys and an oil thickness table from the Bonn Agreement that gives thick and thin oil ranges based on oil’s color appearance.
“Previous reports based on aircraft and ship surveys showed that the Taylor Energy oil spill was restricted to the vicinity of the damaged platform with an estimated daily spill volume of several gallons or several tens of gallons,” explained Hu. “This study, in contrast, showed a much larger cumulative oil footprint. Although the daily spill volume is much lower than that of Deepwater Horizon, the total spill volume may eventually be comparable to or even higher than Deepwater Horizon because of the prolonged spill period.”
Data are publicly available through the Gulf of Mexico Research Initiative Information and Data Cooperative (GRIIDC) at doi:10.7266/N7M9072W.
The study’s authors are Shaojie Sun, Chuanmin Hu, Oscar Garcia-Pineda, Vassiliki Kourafalou, Matthieu Le Henaff, and Yannis Androulidakis.
By Nilde Maggie Dannreuther and Stephanie Ellis. Contact maggied@ngi.msstate.edu with questions or comments.
************
This research was made possible in part by a grant from the Gulf of Mexico Research Initiative (GoMRI) to the Center for the Integrated Modeling and Analysis of Gulf Ecosystems II (C-IMAGE II) and to the University of South Florida, the University of Miami, and Water Mapping, LLC for their project Influence of River Induced Fronts on Hydrocarbon Transport. Other funding sources included a NASA Earth and Space Science Fellowship (NNX16AN95H) and NOAA’s Atlantic Oceanographic and Meteorological Laboratory.
The Gulf of Mexico Research Initiative (GoMRI) is a 10-year independent research program established to study the effect, and the potential associated impact, of hydrocarbon releases on the environment and public health, as well as to develop improved spill mitigation, oil detection, characterization and remediation technologies. An independent and academic 20-member Research Board makes the funding and research direction decisions to ensure the intellectual quality, effectiveness and academic independence of the GoMRI research. All research data, findings and publications will be made publicly available. The program was established through a $500 million financial commitment from BP. For more information, visit https://gulfresearchinitiative.org/.
© Copyright 2010-2019 Gulf of Mexico Research Initiative (GoMRI) – All Rights Reserved. Redistribution is encouraged with acknowledgement to the Gulf of Mexico Research Initiative (GoMRI). Please credit images and/or videos as done in each article. Questions? Contact web-content editor Nilde “Maggie” Dannreuther, Northern Gulf Institute, Mississippi State University (maggied@ngi.msstate.edu).